> ## Documentation Index
> Fetch the complete documentation index at: https://docs.intelleap.app/llms.txt
> Use this file to discover all available pages before exploring further.
# Analytics
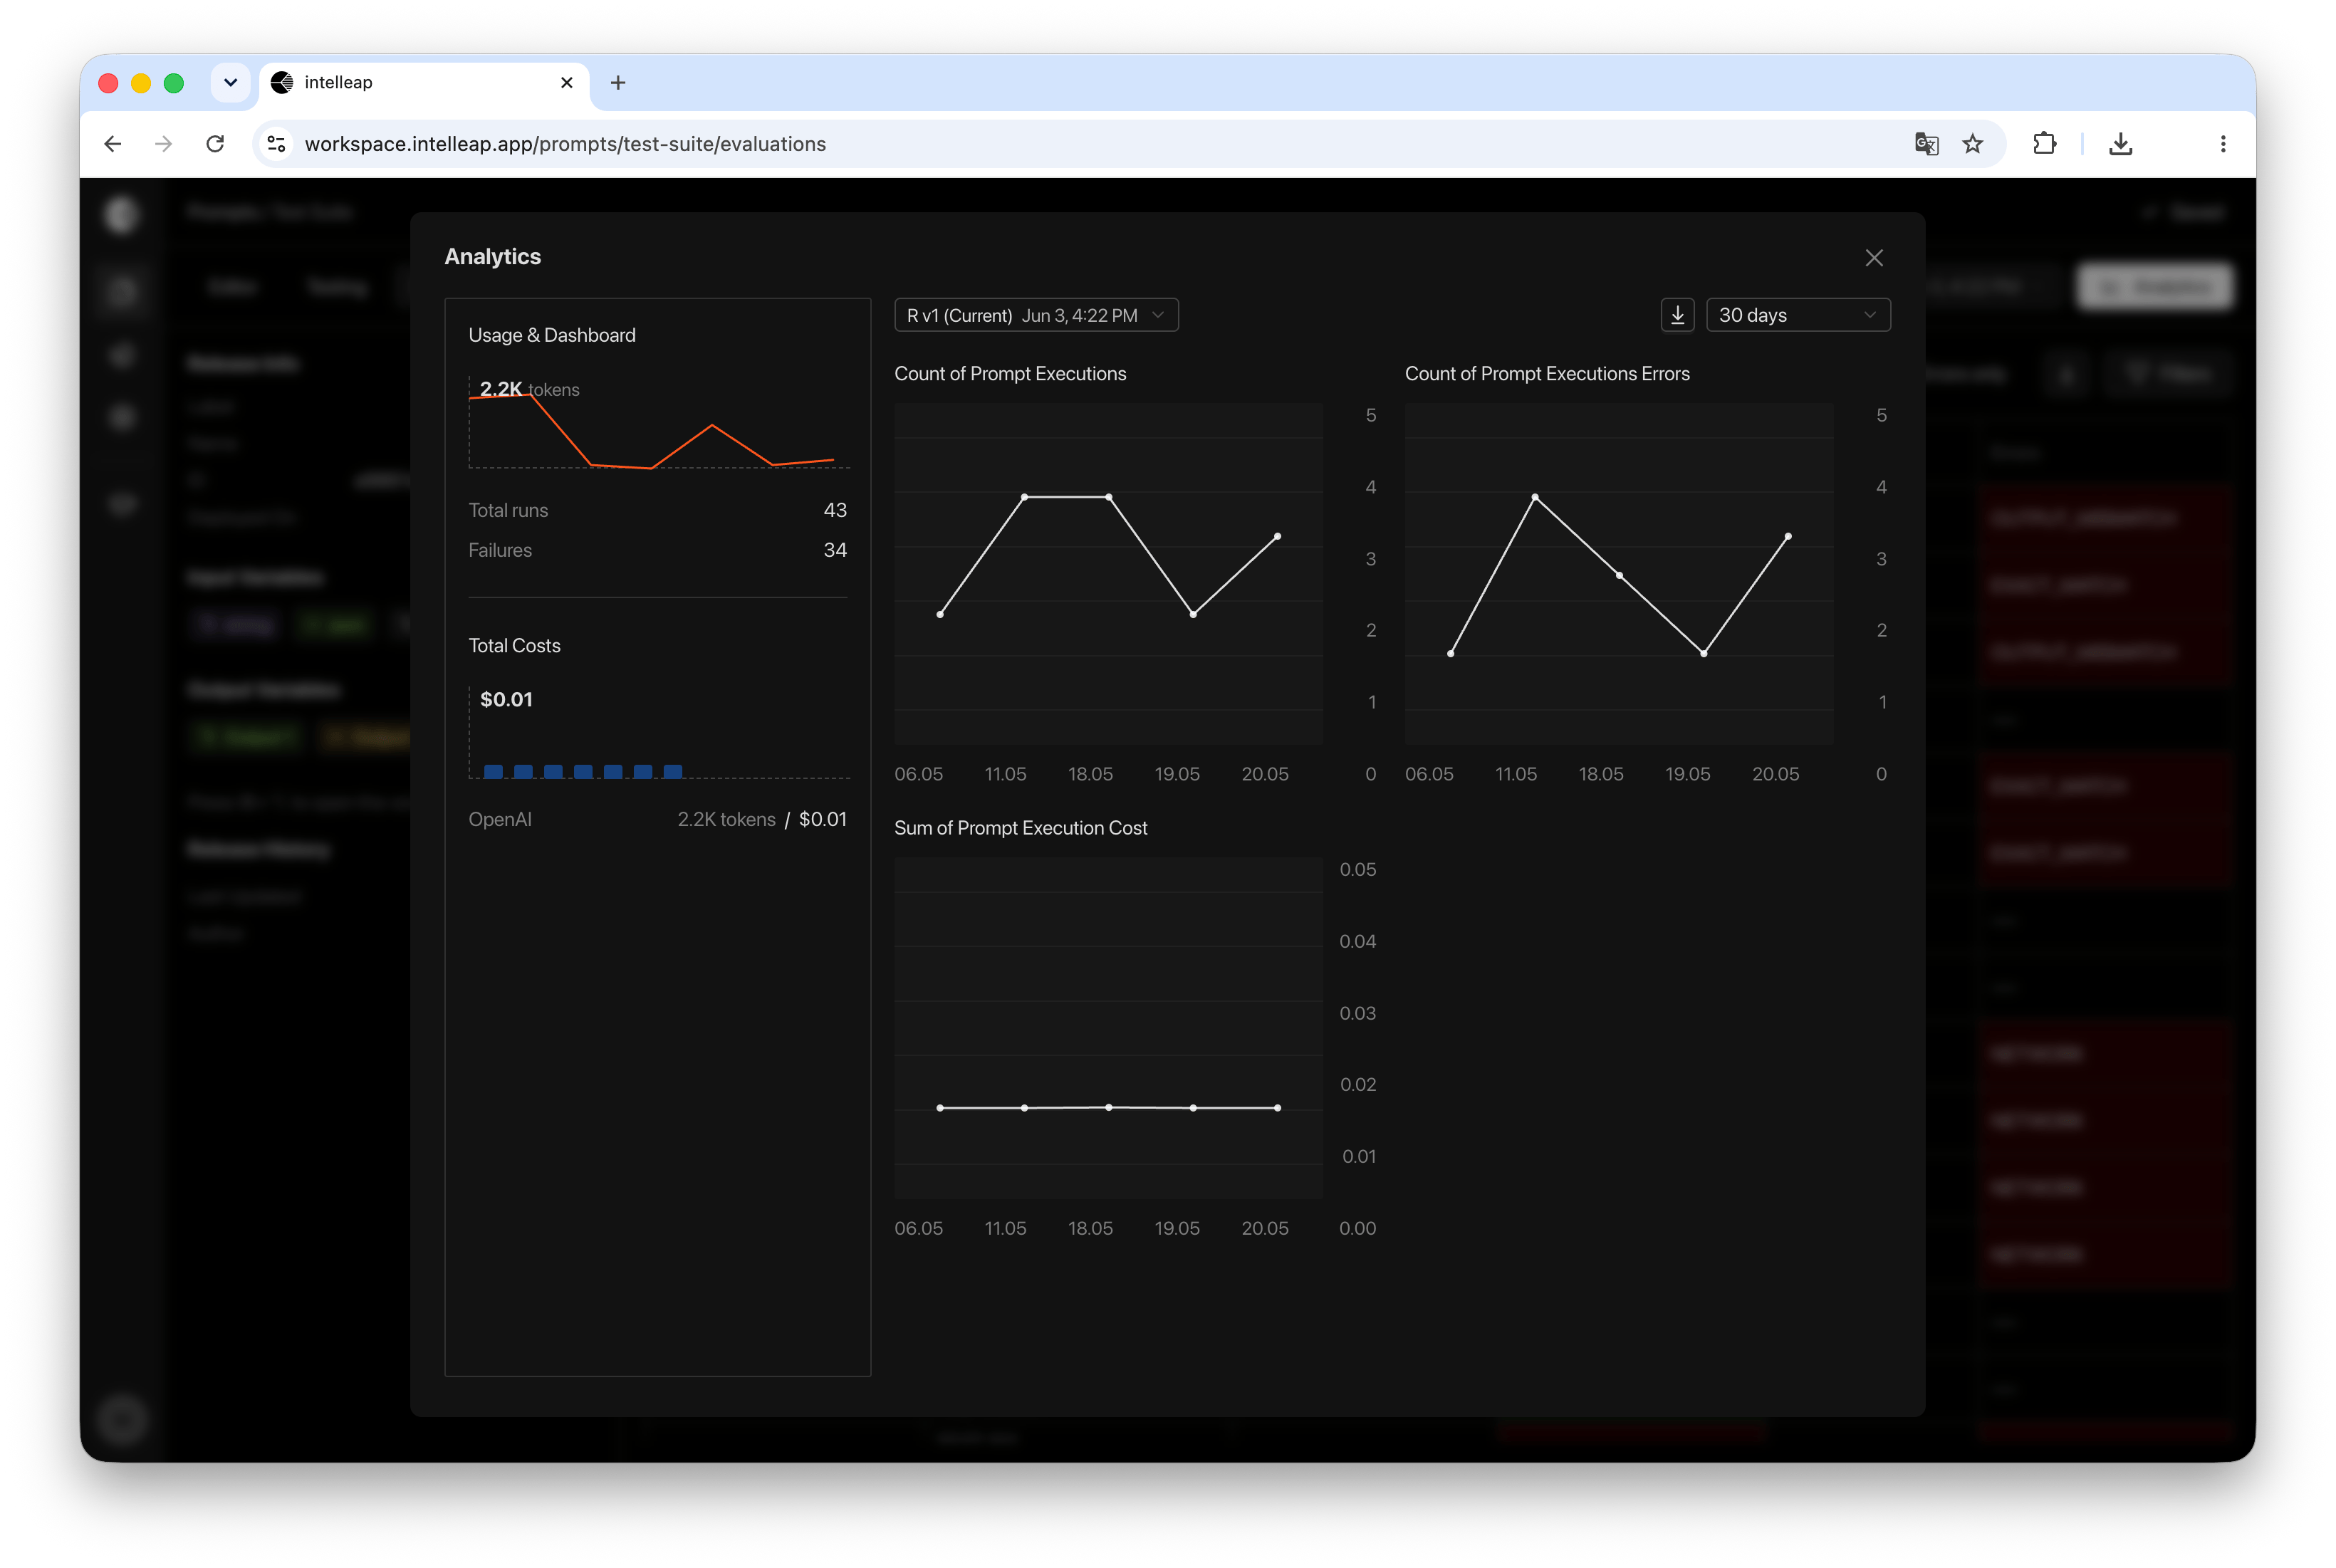
Analytics provides aggregated execution statistics for a selected release.
To open Analytics, click **Analytics** in the upper-right corner of the Evaluations tab.
A modal dialog will open displaying usage metrics, execution statistics, and estimated cost information.
 ## Selecting a Release
The release selector is located at the top of the Analytics dialog.
Analytics always displays data for the currently selected release.
When a different release is selected, all statistics and charts are automatically updated.
## Selecting a Time Period
Analytics supports analyzing data across different time ranges.
Available periods include:
* 7 Days
* 30 Days
* 90 Days
When a new period is selected, all charts and summary metrics are recalculated automatically.
## Summary Metrics
Analytics provides a high-level overview of execution activity for the selected release.
Available metrics include:
Number of executions recorded in the selected period.
Execution failures detected in the selected period.
Approximate cost calculated from available usage and pricing data.
These metrics help users quickly understand usage volume, execution reliability, and overall spending.
## Cost Analysis
Analytics provides an estimated view of execution costs.
Cost estimates are calculated using available model usage data and provider pricing information.
Displayed values are approximate and may differ from actual charges reported by model providers.
Cost values are estimates and should not be used as billing records.
## Provider Breakdown
When multiple providers are used within a workspace, Analytics displays cost and usage information for each provider.
This helps identify which providers and models contribute most to overall usage and spending.
## Usage Charts
Analytics includes visual charts for analyzing execution activity over time.
Depending on available data, charts may include:
* Prompt Execution Count
* Prompt Execution Errors
* Prompt Execution Cost
These charts help identify trends, usage patterns, and periods of increased activity.
## Using Analytics
Analytics helps users:
* Monitor release usage
* Track execution volume
* Review execution failures
* Estimate model costs
* Compare activity across time periods
* Understand provider-level usage distribution
## Selecting a Release
The release selector is located at the top of the Analytics dialog.
Analytics always displays data for the currently selected release.
When a different release is selected, all statistics and charts are automatically updated.
## Selecting a Time Period
Analytics supports analyzing data across different time ranges.
Available periods include:
* 7 Days
* 30 Days
* 90 Days
When a new period is selected, all charts and summary metrics are recalculated automatically.
## Summary Metrics
Analytics provides a high-level overview of execution activity for the selected release.
Available metrics include:
Number of executions recorded in the selected period.
Execution failures detected in the selected period.
Approximate cost calculated from available usage and pricing data.
These metrics help users quickly understand usage volume, execution reliability, and overall spending.
## Cost Analysis
Analytics provides an estimated view of execution costs.
Cost estimates are calculated using available model usage data and provider pricing information.
Displayed values are approximate and may differ from actual charges reported by model providers.
Cost values are estimates and should not be used as billing records.
## Provider Breakdown
When multiple providers are used within a workspace, Analytics displays cost and usage information for each provider.
This helps identify which providers and models contribute most to overall usage and spending.
## Usage Charts
Analytics includes visual charts for analyzing execution activity over time.
Depending on available data, charts may include:
* Prompt Execution Count
* Prompt Execution Errors
* Prompt Execution Cost
These charts help identify trends, usage patterns, and periods of increased activity.
## Using Analytics
Analytics helps users:
* Monitor release usage
* Track execution volume
* Review execution failures
* Estimate model costs
* Compare activity across time periods
* Understand provider-level usage distribution